Notification of Firewall denies
While working with many large organizations, I find that the VPC network administrators lock down their VPCs using custom networks (as opposed to automatic networks) and only allow connectivity within a VPC on explicitly allowed ports. What this means is that if we have an application running on machine A trying to make a network request to a service on machine B (even within the same subnet), if there is no explicit rule to allow the connection, the connection will fail as it is rejected by the firewall system. From the developer's perspective, they may not realize that it is the firewall that is preventing correct operation.
Within the VPC network, there is an implicit rule that denies all ingress traffic into a machine. Since this is an implicit rule, it doesn't show up in the list of firewall rules and, for our discussion, doesn't result in any log re cords being written to Cloud Logging. This means that if we look in the logs we won't have any indication that the application failed (or why it failed).
This implicit rule has the lowest possible priority meaning that if there is any higher priority rule that matches, it will have precedence. It is this notion that is the crux of this post.
We can create a new firewall rule that has higher priority than the implicit deny rule that also denies all traffic. Effectively, an identical rule to the implicit rule. This new rule will not change the outcome of the operating environment. Everything that was allowed before will still be allowed and everything that was denied before will still be denied. However, because this is a custom rule and we have full control over it and we can make one important change to it. We can enable Firewall Logging. What this means is that if the rule is triggered, a log record will be written to Cloud Logging explaini ng that a connection failed and why it failed. The log record will also give us information about the source and target of the request which we could then use to track down the developers who have been scratching their heads wondering why their application wasn't working.
Enabling this custom rule has an additional benefit. Cloud Monitoring is Google Cloud's system for recording operational metrics for analysis. One of the metrics that is generated is how often a firewall rule is triggered. However, there is a caveat to this … the metric is only recorded if the firewall rule has logging enabled. Since the implicit firewall rule that denies all does not have logging enabled, there is normally no metric written to Cloud Logging that we could use for monitoring. Our higher precedence custom rule enables logging and thus makes it available for monitoring. Since firewall rejections of connections are now resulting in metrics, we can leverage the C loud Monitoring alerting subsystem to inform us that requests are being rejected because of firewall rules without us having to continuously watch charts. We can have an email message sent to us to indicate that we might want to investigate the creation of an additional allow rule.
Let us now look at some tests. In the following, we have created a custom VPC network (kolban-network) which contains a single subnet (subnet1) that hosts two Compute Engines (CE1 and CE2). In the first diagram we illustrate the environment from a Google Cloud resources perspective while in the second, we show a classic network diagram.
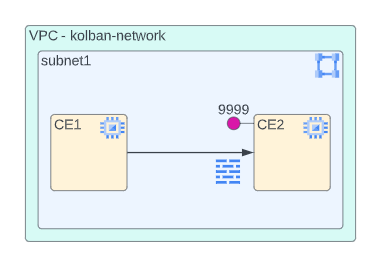

Let us now setup an environment to test our findings. On CE2 we install the netcat package:
sudo apt-get install netcat
and run
nc -lk4 9999
T his causes netcat to listen on port 9999 for incoming connection requests. On CE1 we also install netcat and run:
date | nc -w2 10.1.0.3 9999
This causes a request from CE1 to CE2 to be attempted. What we will find is that on CE2, no data is received. The reason for this is that there is no firewall rule that allows incoming connections from subnet1 on port 9999. The implicit rule prevents any traffic arriving (ingressing) into CE2 that is not explicitly allowed by some rule. After running this test, if we were to look at Cloud Logging we would see no evidence of the denial nor would we see any indication in the monitoring metrics.
Now we get to define our overriding firewall entry to create a new deny rule that has precedence over the implicit deny rule. We create a new rule that looks as follows:
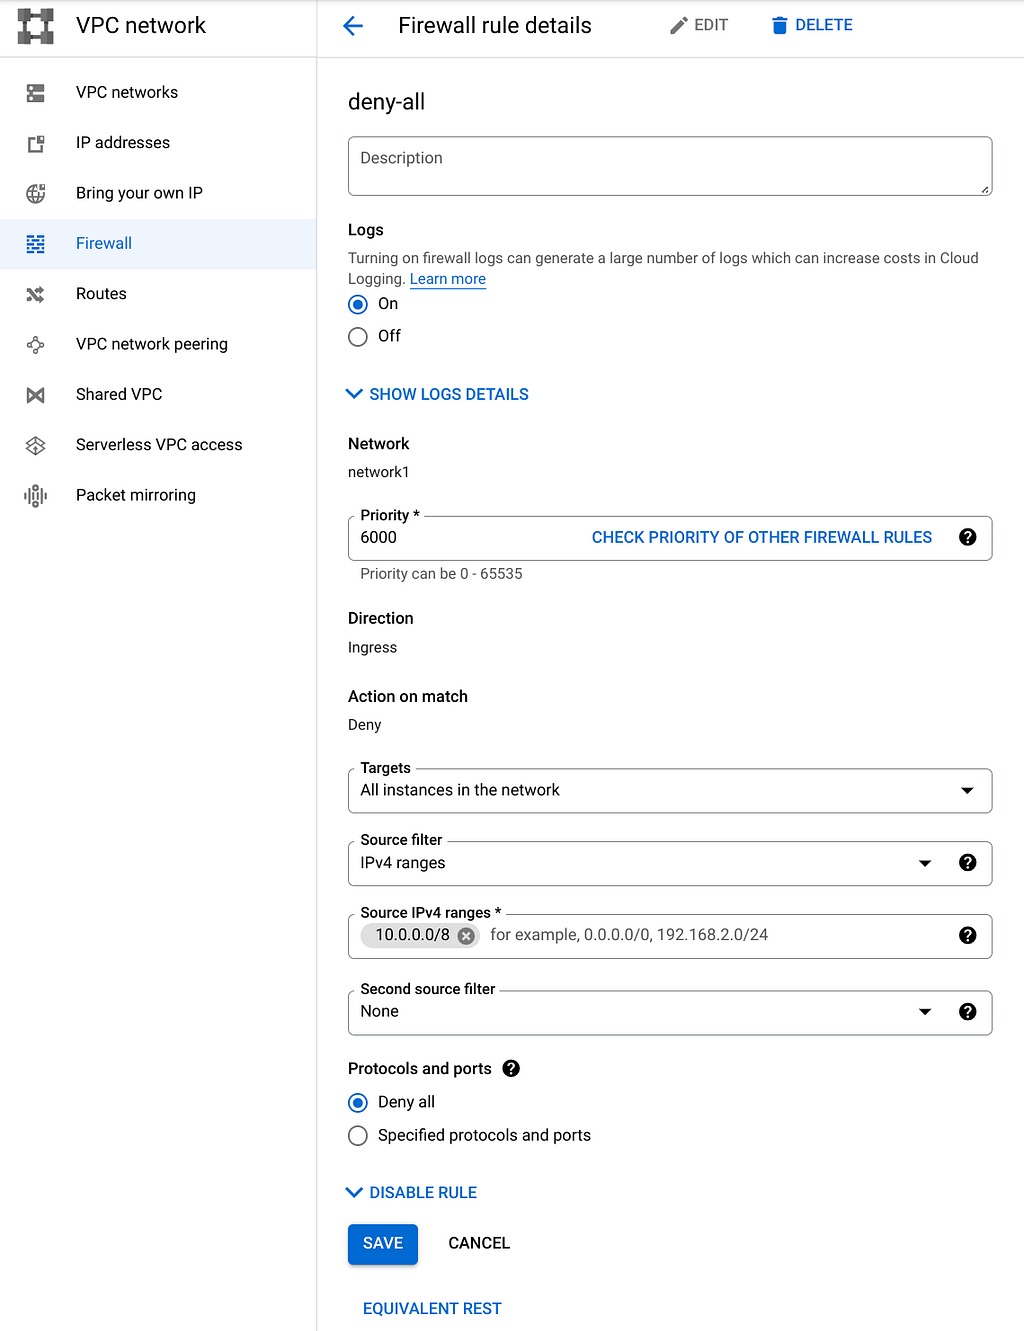
The important things to note from this definition are:
- The rule is called deny-all. (Nothing special about this name, we just need to remember it for later use)
- The rule has logging enabled.
- It has a priority that is higher (numerically lower) than the implicit rule which has a priority of 65535.
- It denies traffic arriving at our VPC network.
- The action to be performed on a rule match is Deny.
- It denies all traffic (all protocols and ports).
If after adding this rule we re-run the data sending command on CE1 to send traffic, once again, we do not see the traffic arrive. We haven't changed the rules other than to cause the denial rule that matches to be our explicit rule that has logging enabled. However, if we examine our Cloud Logging, we will see a new log record has been written (zoom in to see more details):
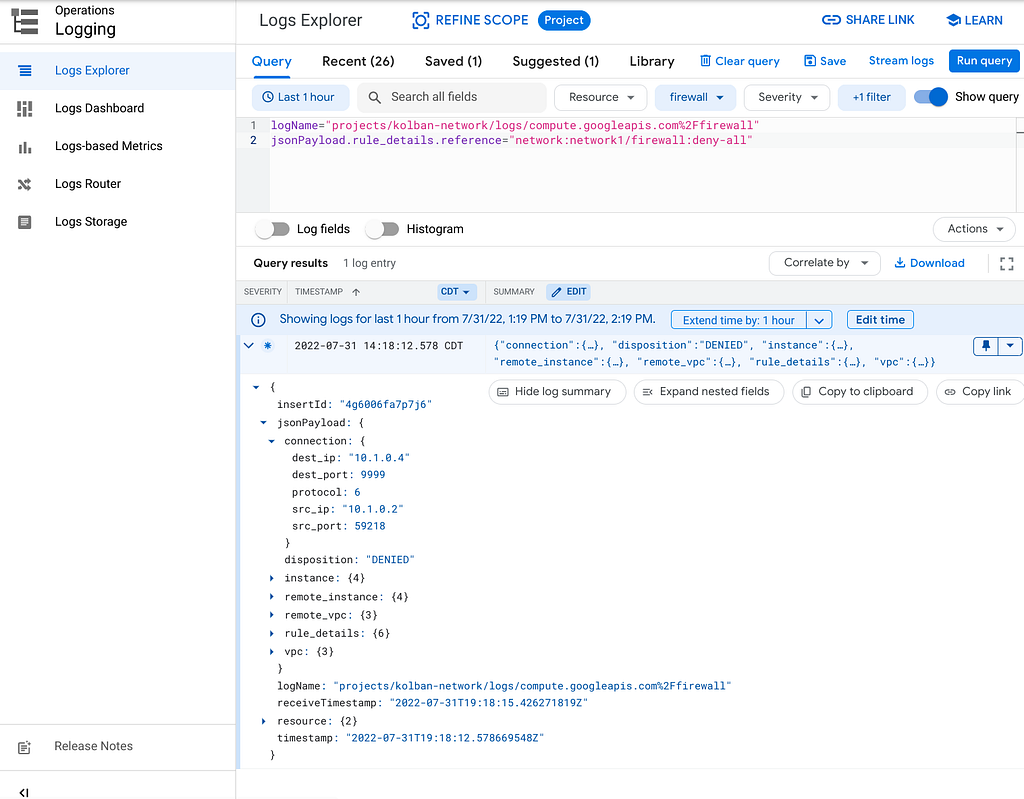
The log record contains a richness of information including the source IP (CE1), the destination IP (CE2) and the port that was attempted to be reached on CE2 (9999). There are many other details that we haven't shown.
What I want you to realize is that now if you were to examine the Cloud Logging logs, you would now have richer information at your disposal. If you were watching, you could immediately learn that something of interest is going on. You could use this information to proactively realize that there might be a development team attempting to run apps that are failing.
Watching logs is not something anyone wants to do on a continuous basis so now let us turn our attention to Cloud Monitoring.
The following is a screen shot from Metrics explorer (part of Cloud Monitoring). This shows us that we can create a chart that shows the number of times that the deny-all firewall rule is triggered.

If we find entries in this chart, we can use Cloud Logging to find the corresponding log records for the interval to determine the nature of the denials. The specific metric we are viewing here is
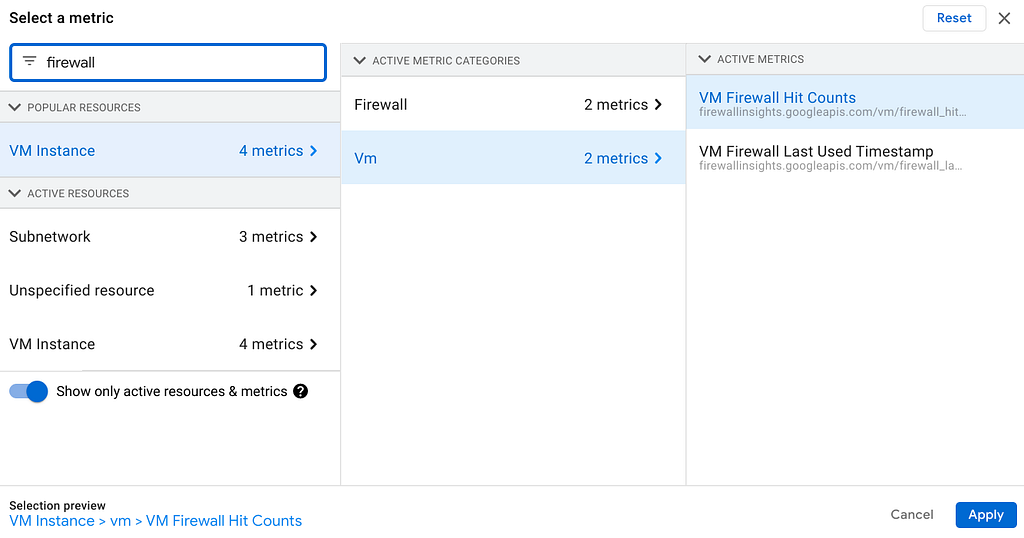
VM Instance -> Vm -> VM Firewall Hit Counts.
We can find this metric document in the firewallinsights section of the manuals and has the metric type of vm/firewall_hit_count.
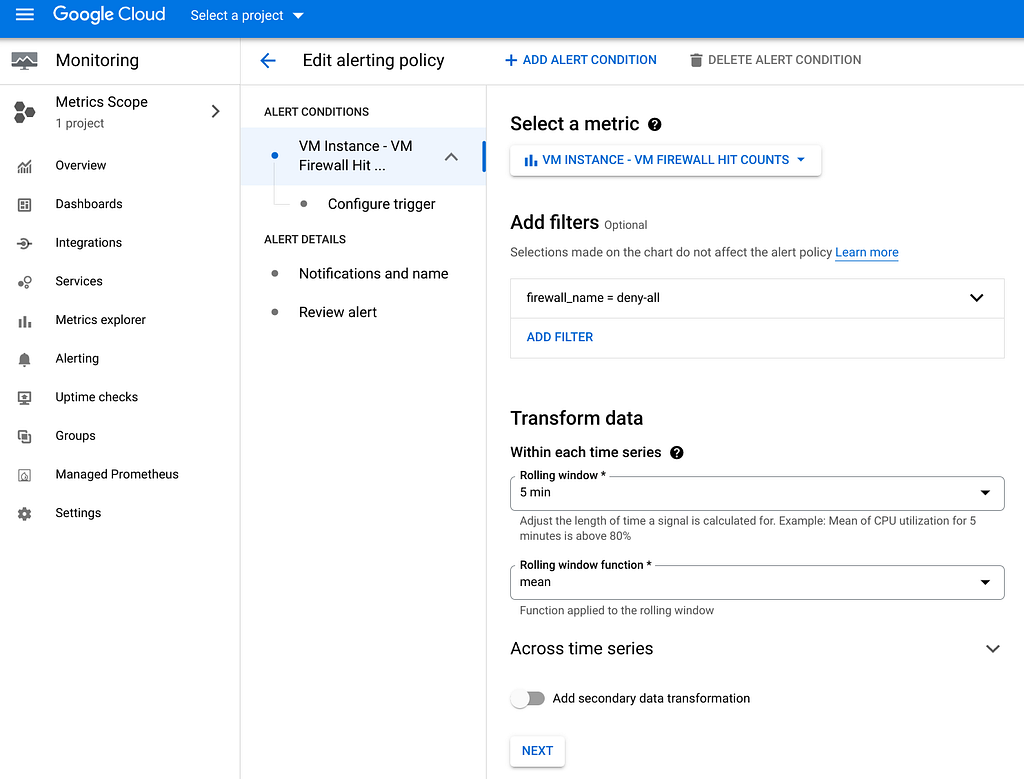
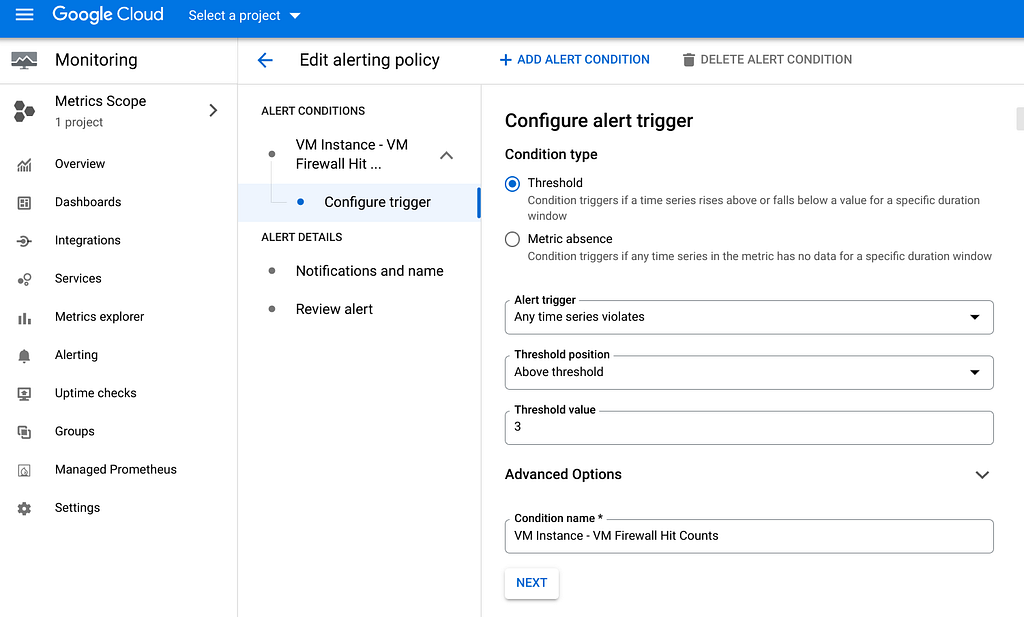
Finally, through the use of Cloud Monitoring alerting, we can create an alerting policy to be notified (emailed) when firewall blocks occur.

An example of a monitoring alert email might be:

And this concludes the post on detecting firewall denies and being alerted when too many of them occur.
Notification of Firewall denies was originally published in Google Cloud - Community on Medium, where people are continuing the conversation by highlighting and responding to this story.
Comments
Post a Comment