Monitor your Kubernetes Cluster (EKS) with Prometheus and Grafana
What is Prometheus?
- Prometheus is an open-source system monitoring and alerting tool.
- It doesn't use protocols such as SNMP or some sort of agent service. Instead, it pulls/scrapes metrics from a client/target over HTTP and places the data into its local time series database that you can query using its own DSL.
- It uses exporters that are installed and configured on the clients in order to convert and expose their metrics in a Prometheus Format. And then Prometheus server scrapes the exporter for metrics.
- You can access the default Prometheus UI via port 9090 on its server.

- Users also have the ability to build dashboards and integrate their visualization software, such as Grafana.
- t uses a separate component for alerting called the AlertManager. The AlertManager receives metrics from the Prometheus server and then it is responsible for grouping and making some meaningful information about the metrics and then forwarding an alert to your chosen notification system.
- You can learn more about Prometheus here.
What is Grafana?
- Grafana is multi-platform open-source analytics and interactive visualization software.
- It is a solution for running data analytics, pulling up metrics, and monitoring our apps with the help of d ashboards.
- It provides charts, graphs, and alerts for the web when connected to supported data sources.

- It provides you with tools to turn your time-series database (TSDB) data into graphs and visualizations.
- You can learn more about Grafana here.
Why do we need System Monitoring?
- To detect and prevent failures, it is very convenient to have a good monitoring tool that provides you with a solid monitoring system.
- Monitoring systems are responsible for controlling the technology used by companies in order to analyze their operation and performance.
- Understanding the state of your infrastructure and systems is essential for ensuring the reliability and stability of your services.
- Information about the health and performance of your deployments not only helps your team react to issues but also gives them the security to make changes with confidence.
What is Helm?
- Helm is a package manager for Kubernetes.
- By using Helm, you can install the Helm charts.
- The Helm chart is not a data visualization tool. A Helm chart is a collection of YAML files.

- You will put all your YAML files in a package. And this package is pushed to any public or private repositories.
- You can access the repositories using the helm command.
In simple terms, Helm charts are a bundled collection of custom YAML files.
- You can learn more about Helm from here.
Prerequisite
- An AWS Account
- Basic knowledge of Prometheus, Grafana, Helm, and Kubernetes
- An EKS Cluster with Helm installed on it
Step 1: Create an EKS Cluster
I've already created my EKS Cluster with helm installed on it. You can follow the below blog to create your own EKS Cluster.
Provision an AWS EKS Cluster using Terraform
I've my 'EKS-Cluster' ready for this tutorial.
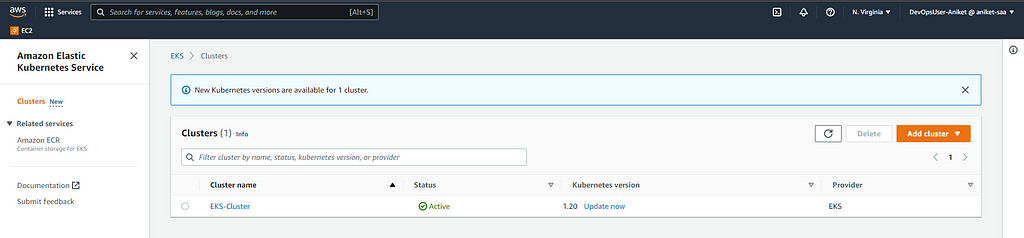
Here, I've created an EKS cluster with 3 Nodes.
$ kubectl get nodes
NAME                        STATUS   ROLES    AGE    VERSION
ip-10-0-2-85.ec2.internal   Ready    <none>   114m   v1.20.15-eks-ba74326
ip-10-0-2-89.ec2.internal   Ready    <none>   113m   v1.20.15-eks-ba74326
ip-10-0-3-70.ec2.internal   Ready    <none>   112m   v1.20.15-eks-ba74326


Step 2: Create Namespaces for Prometheus & Grafana
Before doing the installation of Prometheus & Grafana in our EKS Cluster, first, we are creating 2 different namespaces each for Prometheus & Grafana. You can create namespaces of Prometheus and Grafana by running the following command:
$ kubectl create ns prome theus
namespace/prometheus created
$ kubectl create ns grafana
namespace/grafana created
Here, both Prometheus & Grafana namespaces have been created.
Step-3: Install required Helm Repositories
Run the following command to install Prometheus's Helm Repository:
$ helm repo add prometheus-community https://prometheus-community.github.io/helm-charts
Run the following command to install Grafana's Helm Repository:
$ helm repo add grafana https://grafana.github.io/helm-charts
Now we've successfully added the Prometheus's and Grafana's Helm repositories into our cluster.
Step 4: Install Prometheus
You can run the following command to Install Prometheus:
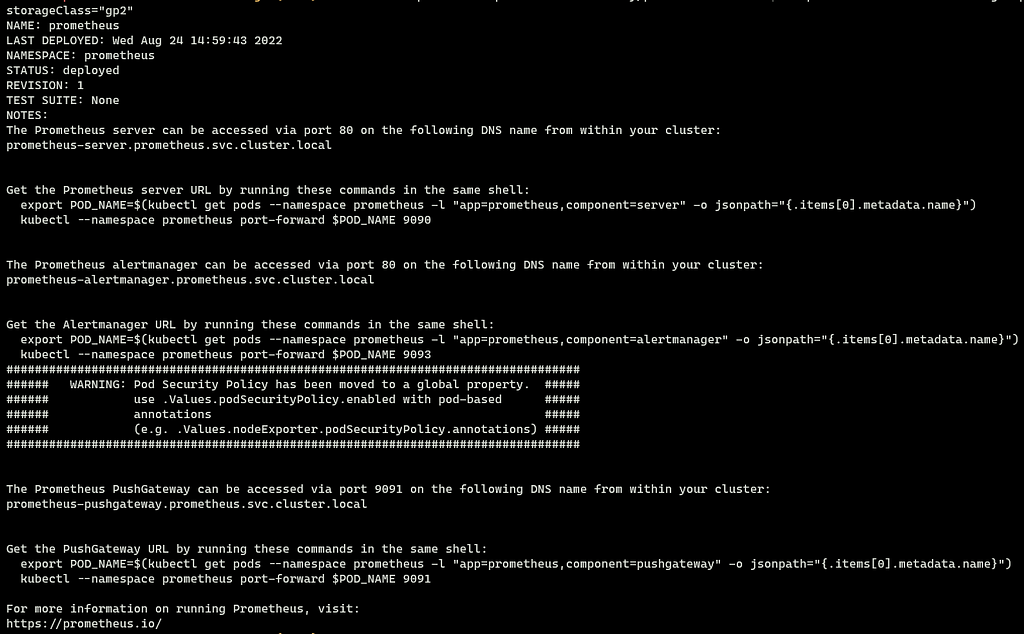
$ helm install prometheus prometheus-community/prometheus --namespace prometheus --set alertmanager.persistentVolume.storageClass="gp2" --set server.persistentVolume.storageClass="gp2"
You'll get the following output.
The above command will create different Kubernetes (k8s) resources in the Prometheus namespace. By running the following command you can check all the resources.
$ kubectl get all -n prometheus
Output:

Step-5 Install Grafana
You can run the following command to Install the Grafana:
$ helm install grafana grafana/grafana --namespace grafana --set persistence.storageClassName="gp2" --set persistence.enabled=true --set adminPassword='EKS' --values ./grafana.yaml --set service.type=LoadBalancer
You'll get the fo llowing output.

The above command will create different Kubernetes (k8s) resources in the Grafana namespace. By running the following command you can check all the resources.
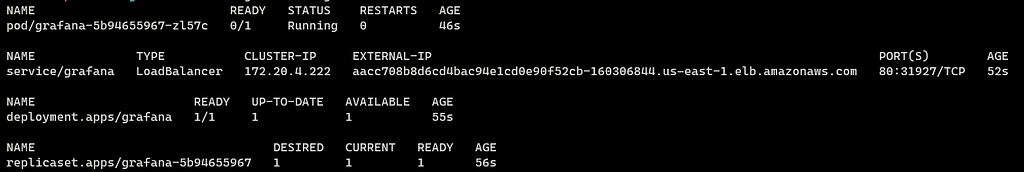
$ kubectl get all -n grafana
Output:
Step-6 Access Prometheus UI
Here, we've successfully installed Prometheus and Grafana in our EKS cluster. Now in order to access the UI of Prometheus, we need to use the concept of Port Forwarding.
Run the following command for Port-Forwarding:
$ kubectl port-forward -n prometheus deploy/prometheus-server 8080:9090
You can access Prometheus UI at <http://localhost:8080>
- Prometheus Dashboard: < /ul>
- Targets:


Step-7 Access Grafana UI
We already have deployed the Grafana as a Load Balancer service in our EKS cluster. So in order to access Grafana's UI, you can run the following command:
$ kubectl get svc -n grafana
You can access Grafana's UI by DNS of the Load Balancer.
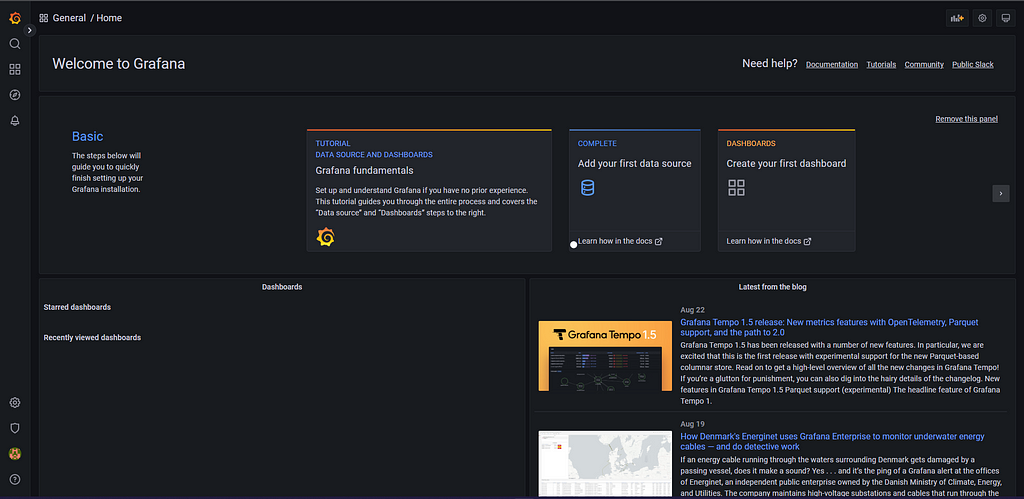
Step-8 Create Dashboard in Grafana
In Grafana we can create various kinds of dashboards as per our needs. We also have pre-created dashboards in Grafana and we can import them us ing the Dashboard number. For this tutorial, we will import one of the pre-created dashboards. Click on Import and add 3119 (ID of the dashboard)
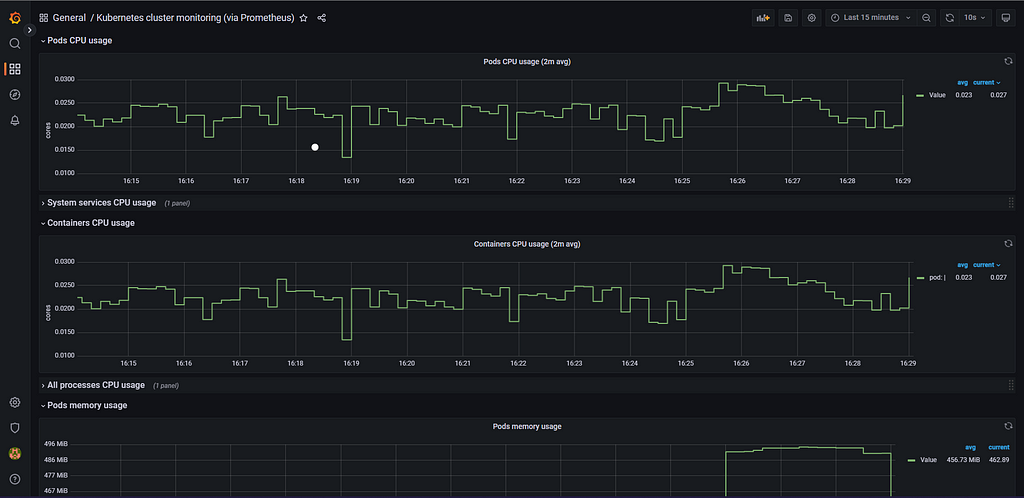
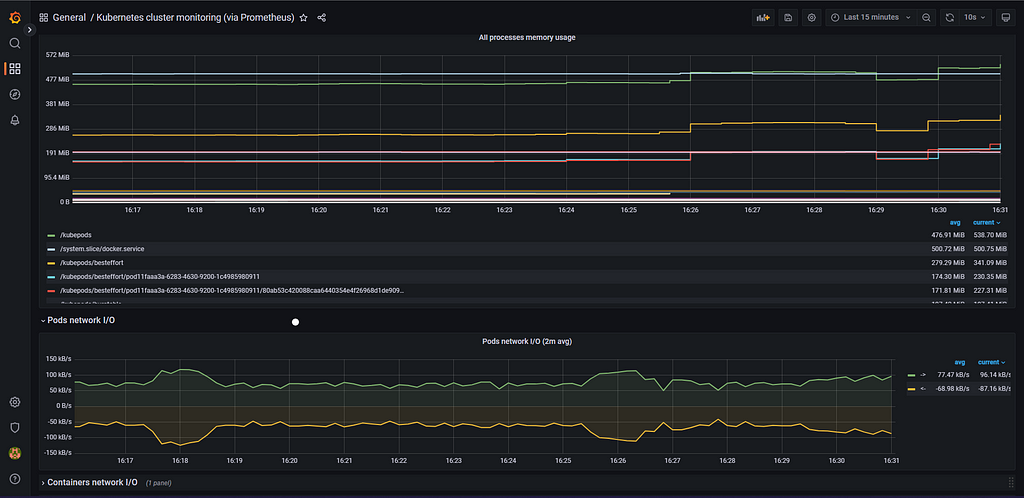
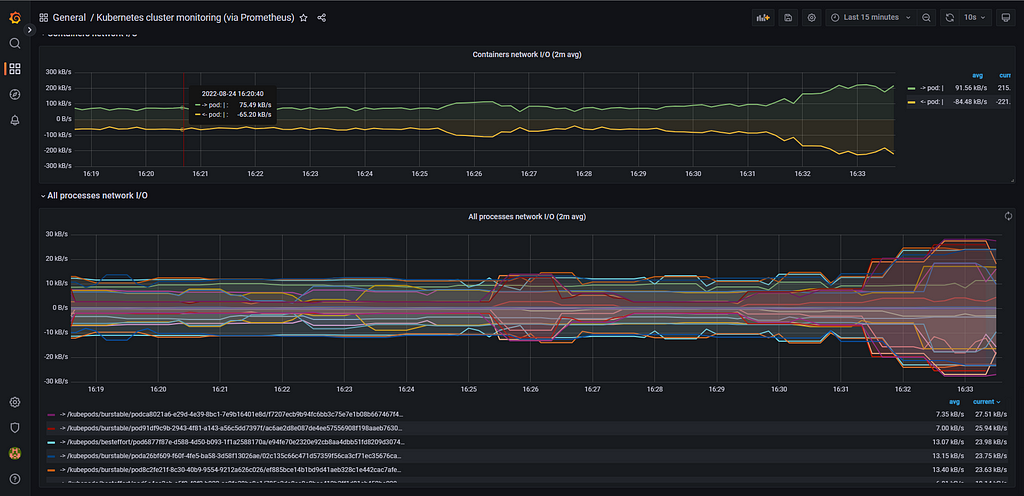
It will import the below dashboard.

You can view different details related to our Kubernetes Cluster like Network I/O, Cluster Memory Usage Cluster CPU usage, etc. We can modify the dashboard as per our needs also.

Here, in the Grafana you can make changes as per your requirements. You can explore more about EKS, Prometheus, and Grafana.
If you find this blog please follow me on LinkedIn and Twitter. I would like to connect with you and have a conversation about DevOps/Cloud topics.
LinkedIn: https://www.linkedin.com/in/aniket-patel-2a52851a3/
Twitter: https://mobile.twitter.com/aniii_patel12
Follow me here for more interesting blogs like this.
Monitor your Kubernetes Cluster (EKS) with Prometheus and Grafana was originally published in Towards AWS on Medium, where people are continuing the conversation by highlighting and responding to this story.
Comments
Post a Comment